New on Enplug: Market Tracker App Shows Visual Financial Data
Half of all Americans have money in the stock market. If you display an eye-catching, up-to-date market tracker with stock tickers and other financial data on your screens, you’re sure to attract an audience.

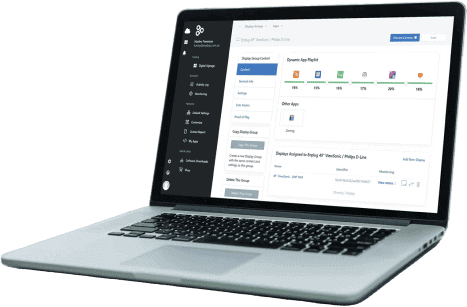
With Enplug’s new Market Tracker App, customers can choose from a variety of types of financial content and designs for their displays. From the Enplug Dashboard, simply enable the Market Tracker App, select how long you’d like each visual to play, choose from the content options below, and pick from the four available color themes.
- Individual Symbol: The current price and today’s price movement of any stock, as well as a graph of its price over the past 6 months.
- Financial Movers: A list of the Top 100 stocks that are experiencing the largest price changes today.
- Financial Markets: A summary of the NASDAQ, New York Stock Exchange, and the S&P 500.
- Financial Currency: A view of exchange rates across the world’s top currencies in relation to the US dollar.
- Financial Metals: Indexes of today’s commodity prices for major metals with silver, copper, gold, palladium, and platinum.
- Financial Agriculture: Commodity prices for corn, oats, soybeans, and wheat.

Market Tracker is the latest addition to Enplug’s growing Digital Signage App Market. It is currently free for all users. In 2017, it will become a premium paid app with a low monthly rate for each display group using the app.
Not using Enplug digital signage yet? See why we make financial sense by requesting a demo.
***
Enplug digital signage software was co-founded by CEO Nanxi Liu and CTO Tina Denuit-Wojcik in 2012 to enable organizations to use customized real-time streaming content to create engaging external and internal communications.
on December 1, 2016 7:04 am